why the “Ethereum triple bottom” story matters
A textbook Ethereum triple bottom forming around the $3,700–$3,800 zone is catching traders’ attention because it combines classic technical structure with real on-chain evidence: large whales quietly accumulating and apparent supply absorption from smaller holders. If the pattern confirms with a breakout above nearby resistance, the measured move points toward a potential test (or retest) of the $4,000 area — a psychologically important level that could trigger further momentum. In this post we’ll unpack the technical, examine the on-chain whale behavior, walk through risk scenarios, and give practical ideas for traders and investors — all with a focus on what the triple bottom actually implies. TradingView
What is a Ethereum triple bottom (quick primer)
Ethereum triple bottom is a bullish reversal pattern in technical analysis that appears after a downtrend. It consists of three price lows roughly at the same support area, separated by two intermediate rallies. The pattern signals that sellers repeatedly failed to push the price below a certain level and that buyers are stepping in each time the asset dips to that support. Confirmation happens when price breaks above the resistance formed by the highs of the two intermediate rallies. Traders often estimate the target by measuring the distance from the support to the breakout level and projecting that upward. As with any pattern, confirmation with volume or complementary indicators (RSI, MACD) increases reliability. Investopedia
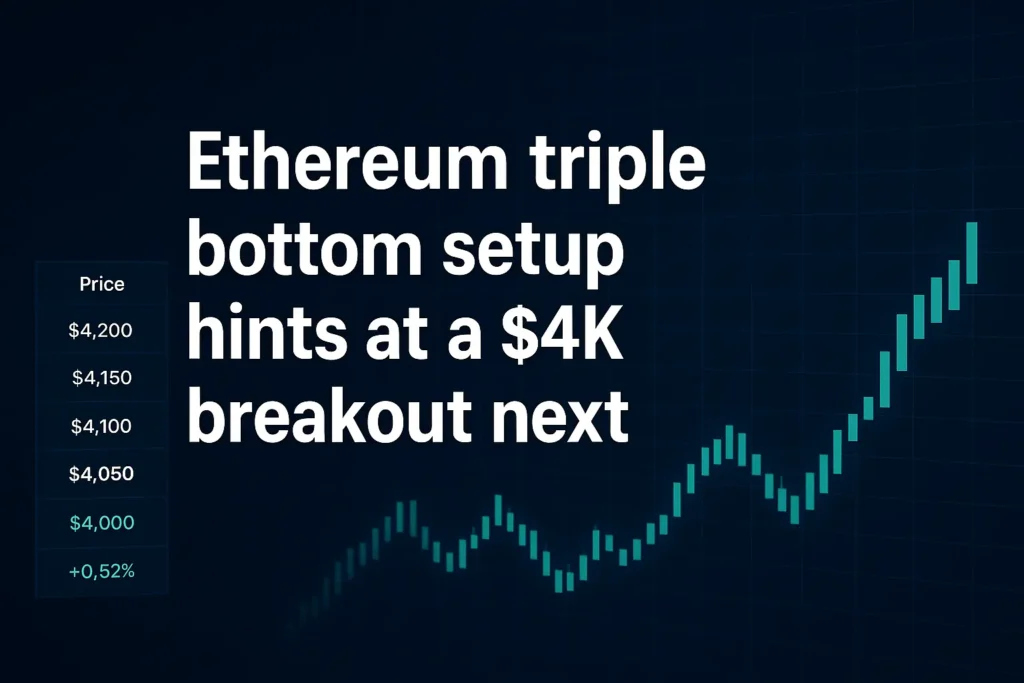
The current setup: price action and the $3,700–$3,800 base
Over the last few weeks, Ethereum’s price has revisited the $3,700–$3,800 range multiple times, creating the three-test structure that technicians label a triple bottom. Each dip into that zone was followed by a measured bounce; importantly, the lows were relatively equal rather than stepping lower, suggesting sellers were losing conviction. The resistance line — the neckline for the pattern — sits slightly above recent swing highs in the low-$4,000 region; a clean breakout there would validate the setup and put $4,000 squarely in play as the next logical target. Recent market coverage has described this exact pattern and highlighted a potential 10% rebound if the breakout confirms. TradingView
On-chain context: whales are reportedly absorbing supply
One of the key supporting narratives behind the triple bottom thesis is on-chain evidence of accumulation by large holders. Several analytics reports and market write-ups point to “mega whales” (addresses holding tens of thousands of ETH) quietly buying the dips and absorbing coins sold by smaller, more reactive holders. That dynamic — institutions or large holders soaking up supply while retail exits — can transform a technical support zone into a durable base. On-chain accumulation often precedes durable rallies because the available float tightens and the price needs fewer buyers to move upward. yellow.com
Why $4K matters (psychology + technical)
$4,000 is a psychological round number and a technical milestone. If the triple bottom is confirmed, traders will treat a breakout above the neckline as evidence that buyers are back in control. The measured move from a $3,750 base to a breakout near $4,000 implies a potential rally target in the low-to-mid $4,000s depending on the exact breakout level used. Moreover, holding above $4,000 (or reclaiming it decisively) changes market perception: swing traders and algorithmic liquidity providers may increase exposure, and traders who were short or neutral might be forced to cover, adding short-squeeze fuel. Recent technical write-ups identify $4,000 as the next battleground zone. CoinCentral
Confirming signals to watch (how to validate the breakout)
A breakout that matters is more than a single candle above resistance. Here’s a practical checklist to validate the Ethereum triple bottom breakout:
- Volume spike on breakout: The breakout should occur with above-average trading volume — that shows conviction.
- Open interest & funding rates: If derivatives open interest rises and funding rates remain reasonable, the breakout has structural support; extreme funding spikes can warn of crowded leverage.
- On-chain flows: Continued whale accumulation or falling exchange balances strengthens the narrative of supply absorption.
- Momentum indicators: RSI crossing back to neutral/overbought from oversold and a bullish MACD crossover add confirmation.
- Retest behavior: A healthy breakout will often retest the neckline; the pattern is stronger if the former resistance becomes support on the retest.
Monitoring these signals helps separate a genuine breakout from a false move (a “fake-out”). Several market reports pointing to a triple bottom emphasize the importance of volume and on-chain backing. TradingView
The role of whales and institutional flows: mechanics and implications
When large holders buy into dips, they reduce the circulating supply available on exchanges and create a form of price floor. Large buys can be stealthy — broken up into many smaller orders across venues — or they can show up as big OTC trades and transfers into custody. Institutional and whale accumulation has a twofold effect: direct buying pressure and market psychology (others perceive the move as validation). However, it’s important to note that whales can also exit positions in large chunks, which would reverse the positive effect — so monitoring active on-chain flows and exchange balances is essential. Market coverage in October 2025 documents both accumulation and significant whale buys that correspond with recent support behavior. yellow.com
Bullish scenarios (if the triple bottom confirms)
If Ethereum breaks above the neckline and the confirmation checklist checks out, here are possible bullish outcomes:
- Immediate $4K test and hold: Price reclaims $4,000 and consolidates above it. That would encourage more buyers and potentially draw in momentum players. CoinCentral
- Measured move to the mid-$4,000s: Using the classic pattern projection (distance from base to neckline), a target in the low-to-mid $4,000s is realistic.
- Broader market follow-through: Confirmation could trigger rotation into other large caps and DeFi tokens, improving market breadth and liquidity.
- Volatility expansion: A confirmed breakout often widens intraday ranges, offering trading opportunities but also raising risk.
These scenarios are conditional — the strength and persistence of the breakout define which plays out. TradingView
Bearish scenarios & failure modes (what could go wrong)
Patterns fail. Here are the key failure modes for the Ethereum triple bottom thesis:
- False breakout / shakeout: A quick spike above the neckline followed by rapid rejection can trap breakout buyers and trigger stop-runs. Several recent articles have highlighted that ETH can “fail again above $4K,” warning about shakeouts. Crypto Adventure
- Whale distribution: Whales may accumulate into weakness and then distribute into strength (sell into the breakout), capping upside. On-chain monitoring is important because accumulation doesn’t guarantee long-term holding. yellow.com
- Macro shocks: Broader risk-off events (rate surprises, geopolitical shocks) can sweep risk assets lower regardless of technical setups.
- Volatility crush / implied vol drop: If implied volatility drops sharply, options-based bullish plays can underperform even as spot moves modestly.
Risk management and position sizing are essential. Triple bottoms are attractive, but they must be respected with stops and contingency plans. Crypto Adventure
Practical trade ideas (NOT financial advice)
Below are generalized, tactical approaches depending on risk appetite. These are educational examples, not recommendations.
Conservative (investor):
- Accumulate in layers below the $3,800 support with a long-term horizon. Use small, regular buys and maintain a maximum allocation cap. Consider protective put options if downside protection is desired.
Balanced (swing trader):
- Wait for a confirmed breakout above the neckline with volume. Enter a position on the breakout or a successful retest of the new support. Place a stop just below the retest low and scale out partial profits near $4,000 and mid-$4,000 targets.
Aggressive (speculator):
- Buy short-dated call spreads that target the $4,000 area to limit premium outlay and downside. Alternatively, pair a long spot position with short-dated covered calls to offset some cost.
Pairs/trend hedged:
- Use a collar (long ETH + buy protective puts + sell out-of-the-money calls) to limit downside while keeping upside exposure, especially around high-volatility events.
Whichever approach you choose, size positions relative to your risk tolerance and avoid overleverage. Monitor funding rates and open interest in derivatives to avoid being on the wrong side of leveraged flows. FX Leaders
How to monitor the setup in real time (tools and metrics)
To track the Ethereum triple bottom in practice, use a combination of on-chain analytics, technical indicators, and derivatives metrics:
- Charting: Daily and 4-hour candles to monitor the pattern and breakout; volume profile to see buying interest.
- On-chain dashboards: Exchange inflows/outflows, whale transfers, and large address accumulation (Santiment, Glassnode, IntoTheBlock). AInvest
- Derivatives feeds: Options open interest by strike, futures open interest, and funding rates (Deribit, OKX, Binance data).
- Newsflow: Watch headlines for ETF flows, regulatory updates, and macro releases that could sway sentiment.
- Alerts: Set conditional alerts for price crossing the neckline, exchange outflows exceeding a threshold, or a sudden change in funding rates.
Combining these data sources gives a clearer picture than relying on technicals alone. coinglass
Broader market context (why this breakout matters beyond price)
A confirmed breakout from a well-defined triple bottom would suggest more than a short-term move for Ethereum: it signals that market participants are confident enough to absorb sell pressure and push price higher. That can encourage more institutional allocations into Ether-linked products and increase DeFi activity (higher TVL), both of which can have lasting effects on network economics. Conversely, if $4,000 fails as a hold level, it could undermine confidence and lead to renewed selling pressure — so the stakes are structural as well as tactical. Recent reporting highlights both accumulation trends and technical resilience, underscoring the significance of any confirmed breakout. AInvest
Conclusion — balanced view on the Ethereum triple bottom thesis
The Ethereum triple bottom setup at $3,700–$3,800 is a legitimate technical pattern supported by on-chain signs of accumulation from large holders. If price breaks above the neckline with conviction (volume, derivatives support, retest), the path to $4,000 and beyond becomes materially more likely. Yet patterns can fail — whales can distribute, macro shocks can flip sentiment, and false breakouts happen often. Successful participants will combine technical confirmation with on-chain signals and strict risk management. Treat the $4,000 breakout thesis as a probability play, not a certainty. TradingView
Disclaimer
This post is for educational and informational purposes only and does not constitute financial, legal, or tax advice. Cryptocurrency trading is risky and can result in the loss of capital. Always perform your own research (DYOR), use appropriate position sizing, and consult a licensed financial professional before making investment decisions. Do at your own risk. Investopedia
Author Review
Do at your own risk.
Author: Ali hamza